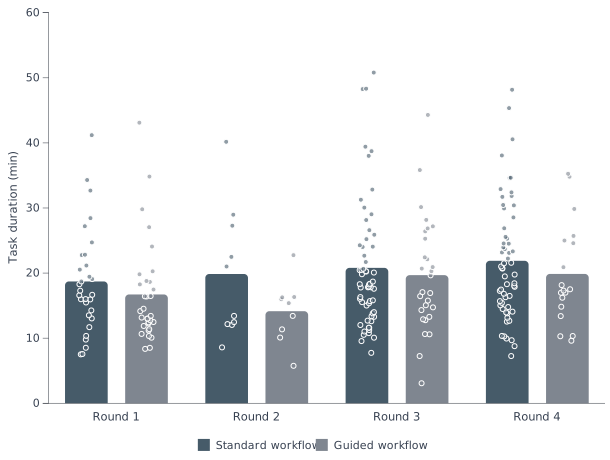
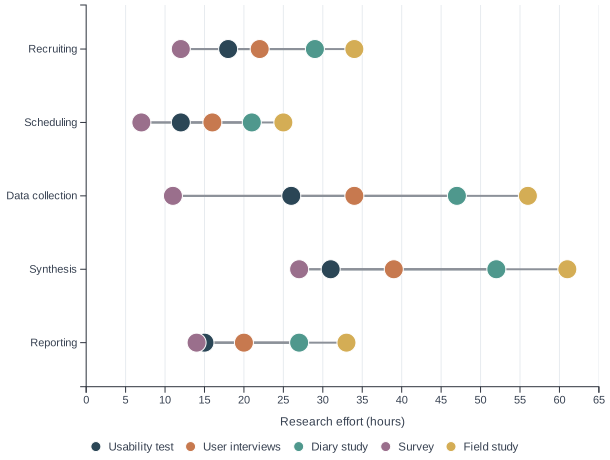
No more tool hopping
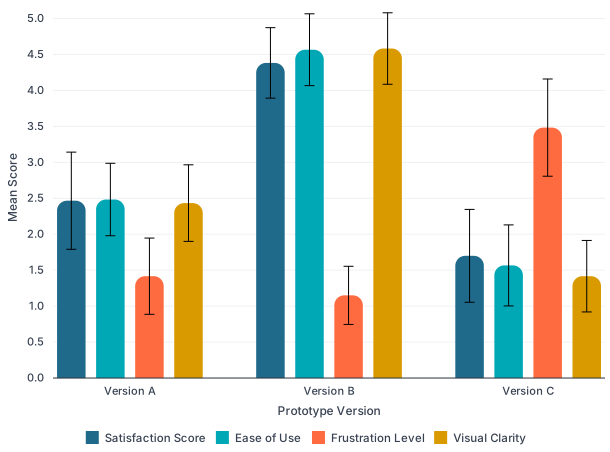
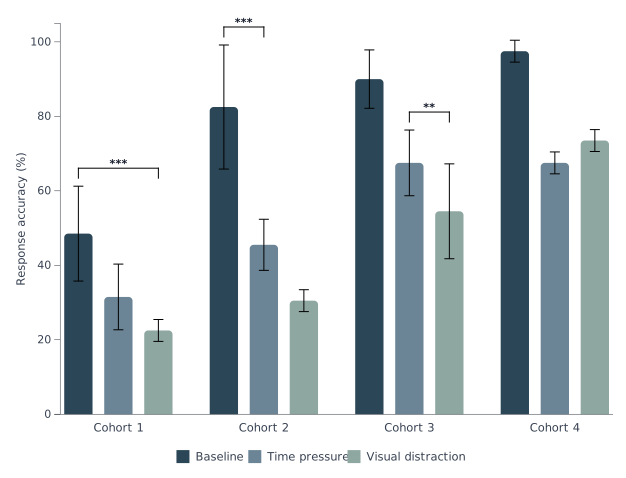
Add error bars, significance markers, and other details researchers usually refine elsewhere, right in SprintGraph.

SprintGraph is a browser-based figure builder that turns spreadsheet-
style data into polished, research-ready figures.
Add error bars, significance markers, and other details researchers usually refine elsewhere, right in SprintGraph.
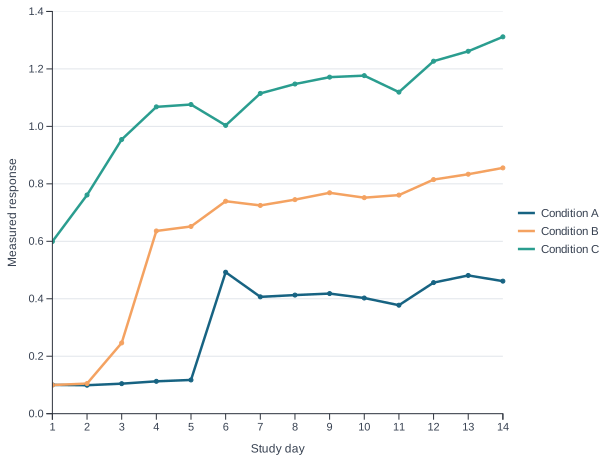
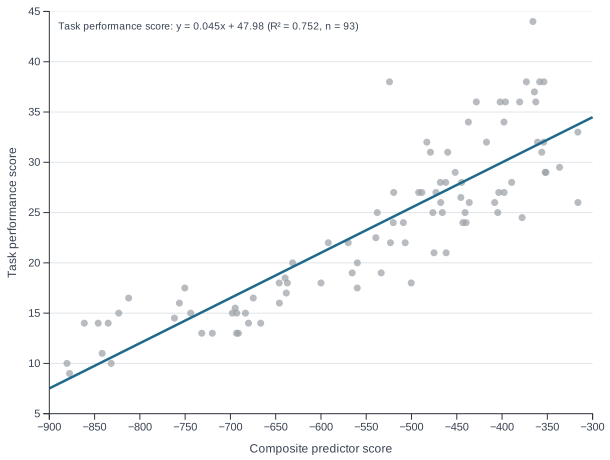
Start with a professionally designed template, then fine-tune every detail to fit your figure.
Your datasets are processed locally and never sent to or stored on SprintGraph servers.
SprintGraph builds figures from your data without generative AI inventing or altering your results.
12 figure types
Bar · Grouped Bar · Stacked Bar · Scatter · Line · Area Box · Grouped Box · Violin · Grouped Violin · Dot · Histogram
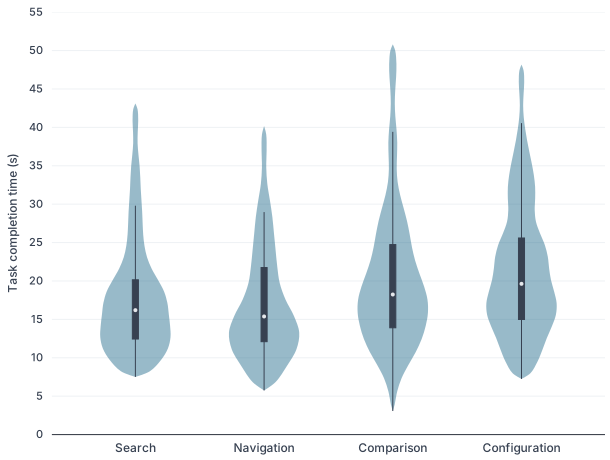
“I loved how easy it was to customize my figure in SprintGraph. The controls felt incredibly intuitive, the presets were polished, and features that are usually a headache in other tools were simple to adjust. It feels powerful and responsive, yet remarkably easy to use.”

Don’t have an account?
Account
You were invited to SprintGraph. Create a new account to receive 14 days of Pro access.
By continuing with Google, you agree to the Terms of Service and acknowledge the Privacy Policy.
Click the link to confirm your email address.
If an account is associated with this email address, we'll send a password reset link to: